On-chain Data Academy (Part 5): How Many People Are Actually Making Money? A Five-Minute Overview of the Objective Sentiment Indicator PSIP


Original Article Title: "On-Chain Data Classroom (Part 5): How Many People Are Actually Making Money? A Five-Minute Guide to the Objective Sentiment Indicator PSIP!"
Original Article Author: Mr. Berg, On-Chain Data Analyst
This article is the 5th part of the On-Chain Data Classroom series, with a total of 10 parts. It will take you step by step through understanding on-chain data analysis. Interested readers are welcome to follow this series.
Related Reading: "On-Chain Data Classroom (Part 4): Visualized BTC Chip Price Distribution Chart"
TL;DR
- This article will introduce the on-chain indicator PSIP
- PSIP = Percentage of Supply in Profit, among circulating $BTC
- It can serve as a guide to market sentiment, with applications in recognizing market tops and bottoms
What is PSIP?
PSIP, short for Percent Supply in Profit, is defined as "the percentage of circulating $BTC that is in a state of profit."
Calculation method:
It distinguishes profit and loss chips by "comparing each $BTC's last transfer price with the current price."
When the current price is higher than a certain $BTC's last transfer price, this $BTC is considered a profit chip.
What if Most Chips Are in a Loss...?
An important application scenario of PSIP is market bottoms. When most chips are in a loss, it is usually a good time to buy the dip.
The logic is straightforward:
Under similar conditions, the more profitable holders, the greater the selling pressure from profit-taking in the market, and vice versa.
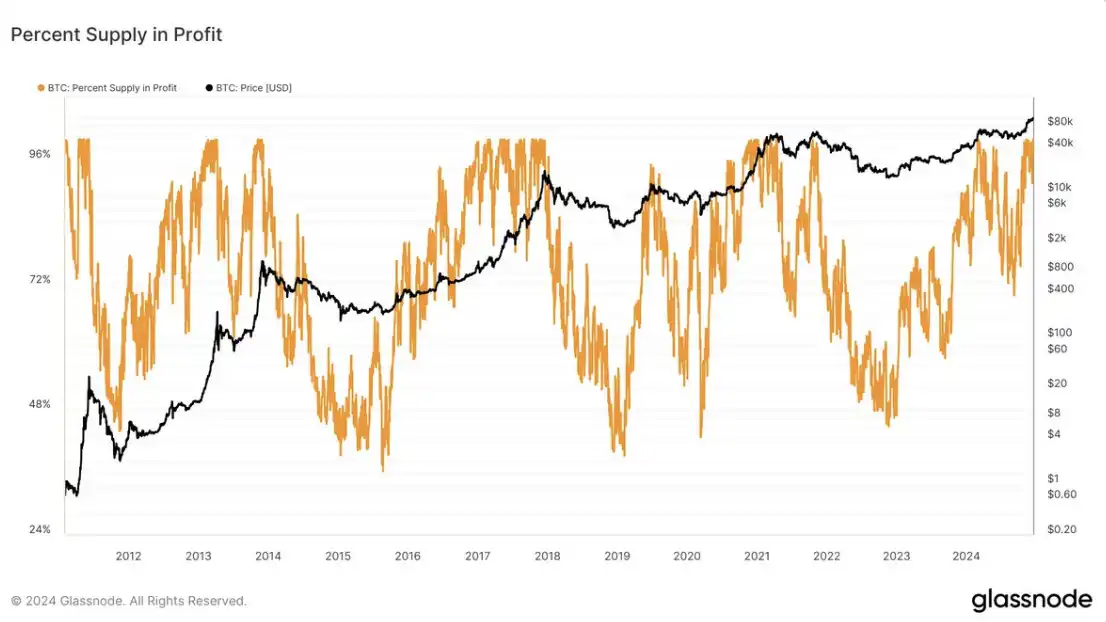
As shown in the chart below, historical points where $BTC had PSIP <50% are marked, indicating very precise opportunities to buy the dip

What if the Majority of Chips are in Profit?
As shown in the chart below, the percentage of chips in profit reaches a maximum value of 100%. Therefore, it is difficult to determine a top based solely on high PSIP.
Here is an interesting logic to share: “Observe the Correlation Change between PSIP and Price”
This idea is derived from the following analysis: The Market Pulse – Week 36, 2022

Conclusion
The above is all the content of On-Chain Data School (Part Five). For readers interested in further studying on-chain data analysis, remember to keep track of this series of articles!
If you want to see more analysis and teaching content on on-chain data, feel free to follow my Twitter account (X)!
I hope this article has been helpful to you. Thank you for reading.
You may also like

Stablecoins are the "royalists" of the crypto world: Open USD brings the old currency system into play
Semiconductor stocks plummet, yet Anthropic wants to create a 2nm chip
Where is Zhao Changpeng's billion-dollar investment going? YZi Labs' investment landscape fully revealed
Ethereum Foundation Report: A Basic Guide to Ethereum for Governments and Financial Institutions
A pre-announced harvesting case: After the cryptocurrency price dropped by 99%, the public chain Saga exited to transform into AI
When American giants collectively "defect" from Chinese AI models
BIS Report Compliance Observation: The Real Risks of Stablecoins, Not Just "Depegging"
Portugal 2-1 Croatia: Ronaldo's 20-Year Knockout-Stage Drought Ends With a Debt Finally Collected
Portugal beat Croatia 2-1 in the 2026 global football championship's knockout rounds as Ronaldo scored his first-ever knockout-stage goal, Gonçalo Ramos struck a stoppage-time winner, and VAR ruled out a late equalizer for offside.
Bitcoin Price Prediction July 2026: Will BTC Recover to $70K or Drop Below $55K?
A South Korean company that learned the strategy of hoarding coins, from a bull market to delisting?
WEEX API Broker Program: Turn Your Trading Platform Into a Revenue Engine
How to choose between buying discounted ETH, Bitmine, and SharpLink?
Wosh: Inflation has cooled in recent weeks, AI is reshaping the economy, and forward guidance has lost its necessity
From Pump.fun to Collector Crypt: Has Solana's income throne changed hands?
Dan Bin's latest speech: Don't miss out on a great era
Robinhood launches its own blockchain, no longer wanting to be a tenant on others' chains
Why Tokenized Stocks Are Booming in 2026 While Crypto Is Still Struggling